Scaling Kernel Module Debugging with EKS, Debug Kernels, and Automation
At Riptides, we secure workload-to-workload (process-to-process) communication using SPIFFE identities and in-kernel policy enforcement. Our kernel module hooks into the Linux networking stack, tags traffic with identities, and enforces mTLS automatically. Because this logic runs in kernel space, bugs aren’t just annoying, they can take down the whole node. A single memory leak, a hidden race condition, or a stack bug can destabilize the entire system.
So the real question is:
How do you debug a kernel module under real workloads, real traffic, and real Kubernetes scheduling quirks and do it repeatedly without guessing?
In this post, we take a production-like environment built around EKS, custom Amazon Linux 2023 debug kernels, Packer-built AMIs, SSM-based versioning, and automated EC2 test runners and show how we use this setup to debug and surface the bugs that only show up under real load.
Important note: We use EKS as an example in this post because it’s our primary cloud for development and testing, but the same pipeline works across all major clouds. For every Riptides major version/release candidate, we run the full debug process on AWS, Azure, GCP, and OCI using automation we’ve built for each. For on-prem customers — whether bare metal or VM-based — we recreate the same environment so we can test and reproduce any potential issues before deployment.
This post extends the concepts from our earlier deep-dive: Practical Linux Kernel Debugging: From pr_debug() to KASAN/KFENCE which focused on how we debug kernel modules using pr_debug, dynamic debug, KASAN, KFENCE, kmemleak, lockdep, and other instrumentation. It also builds on the foundation of our automated multi-distro, multi-architecture driver build pipeline. But today we’re shifting focus from building the driver to showing how we debug it automatically at scale.
Why Debugging a Kernel Module Requires Special Infrastructure
User-space debugging tools don’t work inside the kernel. When something fails in kernel space, you’re often left with:
- A kernel panic
- A hung CPU
- Silent corruption detected only minutes later
- A cryptic dump in dmesg
- No stack trace at all
Effective kernel debugging requires:
- A kernel compiled with full debugging instrumentation
- A realistic workload environment
- Automated reproducibility
- Centralized visibility into kernel behavior
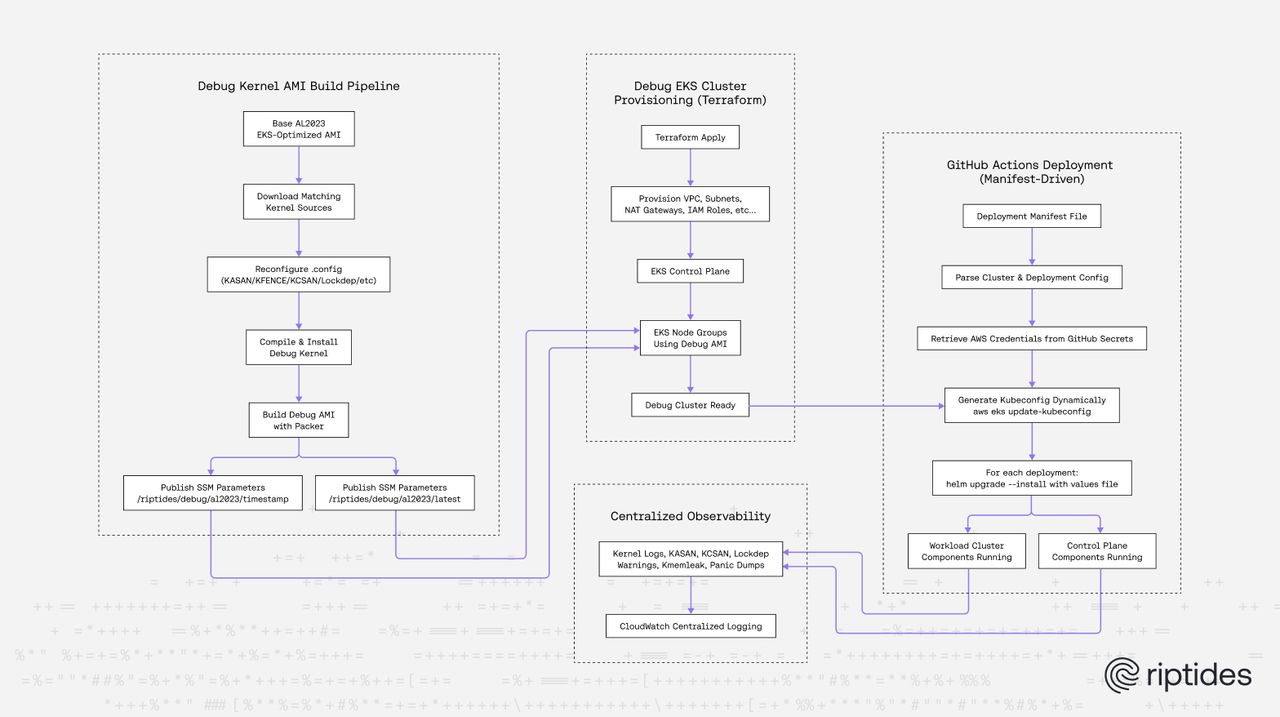
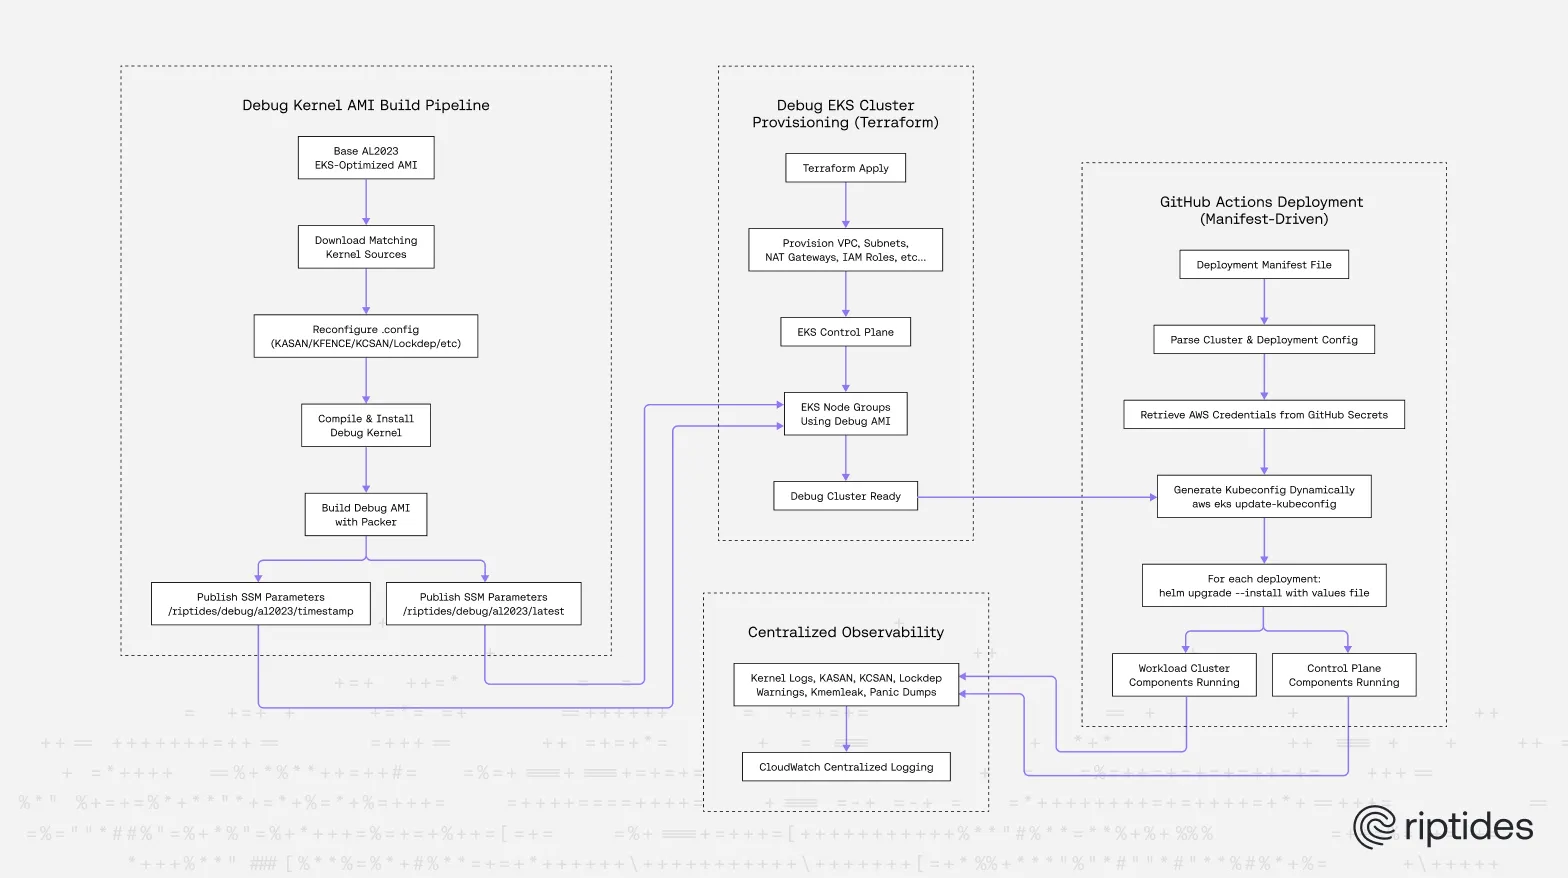
These above led to our Riptides Debug Kernel Pipeline, which combines:
- Custom EKS debug clusters
- Custom Amazon Linux 2023 debug AMIs
- Packer-based kernel recompilation
- CloudWatch-based kernel-level observability
- CI-driven EC2 debug runners
Building the Riptides Debug Kernel
Our debug kernel is based on the same AL2023 kernel used by EKS, but with every relevant debugging feature enabled.
KASAN – Detecting use-after-free, buffer overflows:
CONFIG_KASAN
CONFIG_KASAN_GENERIC
CONFIG_KASAN_OUTLINE
CONFIG_KASAN_STACK
These KASAN options enable the Kernel Address Sanitizer to detect memory safety bugs, such as use-after-free, buffer overflows, and stack out-of-bounds errors—using generic instrumentation with outlined checks and full stack tracing.
KFENCE – Low-overhead heap corruption detection:
CONFIG_KFENCE
CONFIG_KFENCE_SAMPLE_INTERVAL=50
KFENCE complements KASAN by catching memory safety bugs in low-frequency sampling mode (ideal on production-like workloads).
Kernel memory leak detection (kmemleak):
CONFIG_DEBUG_KMEMLEAK
CONFIG_DEBUG_KMEMLEAK_EARLY_LOG_SIZE=400
We run periodic kmemleak scans on all nodes and stream the results into CloudWatch automatically.
Locking, concurrency, and atomic safety:
CONFIG_LOCKDEP
CONFIG_DEBUG_LOCKDEP
CONFIG_DEBUG_SPINLOCK
CONFIG_DEBUG_MUTEXES
CONFIG_PROVE_LOCKING
CONFIG_DEBUG_ATOMIC_SLEEP
Crucial for catching:
- Deadlocks
- Incorrect lock ordering
- Sleeping under spinlocks
- Misuse of atomic contexts
Stack correctness and overflow detection:
CONFIG_DEBUG_STACKOVERFLOW
CONFIG_DEBUG_STACK_USAGE
CONFIG_STACKPROTECTOR
CONFIG_STACKPROTECTOR_STRONG
Important because our module processes network packets on tight kernel stacks.
Memory corruption & SLUB debugging:
CONFIG_PAGE_POISONING
CONFIG_PAGE_OWNER
CONFIG_DEBUG_PAGEALLOC
CONFIG_SLUB_DEBUG
CONFIG_SLUB_DEBUG_ON
These options make silent corruption visible immediately.
KCSAN – Race condition detection:
CONFIG_KCSAN
CONFIG_KCSAN_REPORT_RACE_ONCE=0
Allows us to detect data races inside our driver when multiple sockets, namespaces, or processes interact simultaneously.
Tracing & instrumentation:
CONFIG_FTRACE
CONFIG_FUNCTION_TRACER
CONFIG_KPROBES
CONFIG_KRETPROBES
CONFIG_DEBUG_INFO_DWARF5
CONFIG_BPF_EVENTS
These features let us dynamically hook into kernel functions, trace execution, and debug performance-critical paths.
Safety nets: fail fast on kernel anomalies:
CONFIG_PANIC_ON_OOPS
CONFIG_BOOTPARAM_SOFTLOCKUP_PANIC
CONFIG_BOOTPARAM_HUNG_TASK_PANIC
We force panics on issues that might otherwise go unnoticed, ensuring clear debugging signals.
Building the AMI with Packer
Packer automates:
- Pulling the base AL2023 EKS AMI
- Extracting the matching kernel source version
- Rewriting .config with our debug features
- Recompiling the kernel
- Publishing versioned AMIs
- Writing metadata into SSM
Versioning Debug AMIs via SSM Parameters
To track every debug kernel build, we use an SSM parameter naming scheme:
- /riptides/debug/al2023/{timestamp} - versioned history
- /riptides/debug/al2023/latest - pointer to the newest build
This lets us:
- Reproduce historical issues
- Gradually roll out updated kernels in CI
- Track evolution of kernel instrumentations
This gives us a repeatable and versioned debug kernel, consistent across CI, EKS nodes, and standalone EC2 environments.
A Debug-Optimized EKS Cluster
We run our debug kernel in a dedicated EKS cluster, where Kubernetes naturally generates the noisy, complex environment that exposes timing issues and race conditions:
- CNI networking
- kubelet heartbeats
- inter-pod TLS
- container lifecycle events
- DNS queries
- frequent short-lived TCP connections
This environment surfaces race conditions and timing issues that a quiet VM simply never reveals.
Launch Template Configuration
To run custom AMIs in EKS, we configure:
- Node bootstrap scripts
- Automatic registration to the EKS control plane
- A debug user with developer SSH keys
- CloudWatch agent for kernel logs and kmemleak outputs
Every node becomes a self-contained debug environment.
Centralized Kernel Observability
Every debug node streams to CloudWatch:
- dmesg
- kmemleak scheduled scans
- KASAN reports
- lockdep warnings
- hung task detections
- panic dumps
- stack traces
Provisioning the Debug Cluster with Terraform
Our debug workflow doesn’t start at the kernel level, it starts with the infrastructure. To ensure that the full test suite runs in a consistent, reproducible, production-realistic debug environment, we fully automate provisioning of the debug EKS clusters using Terraform. The cluster is not a one-off experiment. It is a first-class production-grade environment with repeatable configuration, deterministic AMIs, and zero manual steps.
We maintain a dedicated Terraform stack that provisions:
- VPC, subnets, NAT gateways
- EKS control plane
- Managed node groups referencing our debug AMIs
- IAM roles for nodes, CNI
- CloudWatch log groups for kernel debugging output
- SSM parameters for AMI discovery
- Bootstrap user data configures the extra systemd services for CloudWatch observability and provisions developers’ public SSH keys.
Terraform gives us:
- deterministic cluster creation
- trackable infrastructure changes via Git
- version-pinning of AMIs through SSM
- truly reproducible debug environments
Declarative Deployment Manifests: How We Describe Multi-Cluster Riptides Deployments
Once Terraform brings the cluster online, the cluster is still empty. To ensure our debug pipeline remains fully reproducible, we define every deployment to every cluster using a declarative manifest file. This manifest acts as the single source of truth for both our control-plane cluster and workload clusters inside the debug environment.
Unlike hand-written helm install commands or environment-specific scripts, the manifest explicitly declares:
- which cluster to deploy to
- where that cluster is located
- what components belong there
- which chart, version, registry, namespace, and values file to use
This makes deployments deterministic, auditable, and safely CI-friendly.
cpCluster:
  clusterName: riptides-controlplane
  clusterRegion: eu-west-1
  deployments:
    frontend:
      chart: frontend
      version: v0.1.4
      registry: ghcr.io/riptideslabs/helm
      namespace: debug-cp
      valuesFile: frontend-values.yaml
    controlplane:
      chart: controlplane
      version: v0.1.9
      registry: ghcr.io/riptideslabs/helm
      namespace: debug-cp
      valuesFile: cp-values.yaml

workloadCluster:
  clusterName: riptides-debug-apps
  clusterRegion: eu-west-1
  deployments:
    agent:
      chart: agent
      version: v0.1.17
      registry: ghcr.io/riptideslabs/helm
      namespace: riptides-system
      valuesFile: agent-values.yaml
This manifest describes two clusters:
- The Control-Plane Cluster - Runs the Riptides control plane and frontend components.
- The Workload Cluster - Runs the Riptides driver and agent, where the debug kernel instrumentation lives.
The workload cluster cluster runs Amazon Linux 2023 debug kernels, both clusters are provisioned by Terraform, and both are deployed automatically through GitHub Actions.
How GitHub Actions Consumes This Manifest
The deployment workflow reads the manifest, and for each cluster:
- Extracts clusterName and clusterRegion
- Fetches AWS credentials from GitHub Secrets
- Generates a kubeconfig dynamically
- For every component, GitHub Actions executes a
helm upgrade --installcommand using its configured values file.
This makes deployments:
- deterministic
- reproducible
- multi-cluster aware
Periodic CI Runs of the Full Test Suite on the Fully Instrumented Debug Kernel
Cluster debugging is powerful, but we also need periodic validation of the main branch on a debug kernel. We avoid doing this on every PR, since running our full test suite on a heavily instrumented debug kernel takes a significant amount of time.
So we maintain a self-hosted EC2 GitHub runner using the same debug AMI.
- A debug EC2 instance boots
- The Riptides driver installs
- Full test suite runs
- Kernel logs + kmemleak outputs are collected
- Results are sent back to GitHub
- The instance is terminated
This gives developers instant feedback on subtle kernel issues.
Conclusion
Building and debugging Linux kernel modules at scale is challenging, but with the right automation and infrastructure, it becomes manageable. By using EKS, custom debug kernels, Packer, Terraform, and GitHub Actions, Riptides has built a reliable pipeline for rapid iteration and deep kernel visibility. This approach speeds up development, increases deployment confidence, and provides a strong foundation for future growth.
Key Takeaways:
- Debugging kernel modules requires a special-purpose kernel, not a production one.
- We have built a fully instrumented Amazon Linux 2023 debug kernel with KASAN, KFENCE, KCSAN, lockdep, and SLUB debugging.
- Packer automates debug kernel compilation, AMI creation, developer access, EKS setup, and CloudWatch integration.
- We use SSM parameters to version every debug AMI, giving us a reproducible history of kernel builds.
- Terraform provisions the debug clusters declaratively, creating VPCs, IAM roles, EKS control planes, and node groups consistently and repeatably.
- Our GitHub Actions deployment pipeline automatically deploys Riptides components to the clusters using manifest files.
- Our debug EKS cluster provides real-world traffic for validating identity enforcement, TLS behavior, and socket interactions.
- CloudWatch centralizes kernel-level logs, kmemleak output, concurrency detector warnings, and panic traces.
- A self-hosted EC2 GitHub runner ensures periodically the main branch is tested on the debug kernel.
The result is a reproducible, automated debugging pipeline that lets us catch kernel bugs under production-like conditions.
If you enjoyed this post, follow us on LinkedIn and X for more updates. If you'd like to see Riptides in action, get in touch with us for a demo.