At Riptides, we’re building an identity fabric that issues ephemeral, SPIFFE-based identities to workloads and AI agents, enforced entirely in the Linux kernel. This kernel level enforcement gives us deep control and visibility over service-to-service communications, but it also means traditional observability tools fall short. To operate confidently at this layer, telemetry isn’t optional, it’s foundational. It allows us to track how non-human identities behave at the kernel level, verify that policies are being enforced as expected, and correlate identity driven activity with system-wide behavior in real time.
Telemetry: the backbone of modern software operations
Telemetry—metrics, traces, and logs are fundamental to building and operating reliable software systems. For engineers, telemetry is not just a debugging tool; it’s how we observe, measure, and understand the real behavior of our code and workloads across any environment. During development, telemetry exposes performance bottlenecks and logic errors before they reach users. In production, it provides the signals needed for rapid detection, diagnosis, and resolution of incidents. Teams that treat telemetry as a first-class concern can iterate confidently, respond to issues proactively, and continuously improve both their systems and their workflows.
OTEL: the open standard for telemetry
OpenTelemetry (OTEL) has become the lingua franca of observability. It unifies metrics, traces, and logs under a single, vendor-neutral standard. This frees you from backend lock-in and enables flexible, composable telemetry pipelines—from your laptop to the cloud.
OTEL supports most major programming languages and boasts a rapidly growing ecosystem. It’s the backbone of many modern observability stacks. Its unified data model allows you to correlate metrics, traces, and logs for deep, actionable insights. The active community ensures that integrations and features are always evolving.
If you’re still relying on custom scripts and exporters, OTEL offers a more unified and future-proof approach to observability.
However, it’s important to note that while OTEL is very mature for user space applications, its support for kernel-level telemetry is still evolving. Some features are not yet available or may require extra setup when working at the kernel level.
OTEL and eBPF: powerful, but not yet complete
The OpenTelemetry (OTEL) ecosystem is starting to use eBPF (extended Berkeley Packet Filter) to get deeper insights into what’s happening inside Linux systems. This is exciting, because eBPF lets us see things at the kernel level—places that were previously hard to reach without writing custom code or patching the kernel.
OTEL is already great at collecting telemetry from user space applications. Its APIs and SDKs make it easy to add metrics, traces, and logs to your code, and the OTEL Collector can send this data anywhere you want. But when it comes to the kernel, things are still a bit early. Most OTEL libraries are focused on user space, and kernel-level support is still catching up.
Some projects are pushing the boundaries. For example, opentelemetry-network uses eBPF to collect detailed network metrics—like connection tracking, packet counts, and flow statistics—directly from the Linux kernel. This means you can get a lot of network visibility without changing your application code. But there’s a catch: opentelemetry-network only collects metrics, not traces or logs, and it’s focused on network data. If you want to collect generic, high-performance telemetry from deep inside your own kernel modules, you’ll probably need to build or extend something yourself.
In short: OTEL and eBPF together are powerful, and the ecosystem is moving fast. But if you want the same level of observability in the kernel as you have in user space, there’s still some work to do.
Why we built our own eBPF telemetry solution
At Riptides, we quickly realized that existing solutions just didn’t cut it for our use case. Our requirements were:
- Traces to understand performance bottlenecks. Metrics alone can tell you that something is slow, but only traces can show you where the time is being spent inside your kernel module. Without traces, you’re flying blind when it comes to optimizing performance or diagnosing subtle bugs.
- Logs for troubleshooting. When something goes wrong deep in the kernel, logs are often the only way to figure out what happened. Kernel logs can help us catch rare edge cases, unexpected states, or errors that would otherwise be invisible.
- Lightning-fast operation. Kernel modules run at the heart of the operating system. If telemetry collection is slow or inefficient, it can impact not just your module, but the entire OS and all user applications. That’s why we needed a solution that adds almost zero overhead.
- A generic solution. Most existing libraries focus on specific events (like syscalls or network activity). We wanted to collect metrics, traces, and logs from anywhere inside our kernel modules, with fine-grained control over what gets instrumented.
- High-performance data transfer. Many libraries use eBPF hashmaps to send data to user space, but we found that ringbuf (a lockless, high-speed buffer) is much better for our needs—offering lower latency, higher throughput, and simpler code.
- Flexibility to instrument multiple locations. Off-the-shelf solutions often make it hard to add telemetry to many different places in your code. Since we control and implement the kernel modules, we wanted the flexibility to observe exactly what we care about, wherever it happens in our codebase.
- Control over what data is included for correlation. In real-world systems, telemetry comes from many places—applications, infrastructure, and services, not just the kernel module. To correlate kernel telemetry with other data, we needed to control what fields and context were included, so we could tie everything together later. Off-the-shelf solutions rarely give you this level of flexibility.
And while on a single machine you might get by with existing eBPF-based profiling tools or by looking at kernel logs with dmesg, this approach simply doesn’t scale in an enterprise environment. In production, telemetry needs to be collected from many machines and aggregated in a central place—otherwise, you lose the big picture and can’t respond quickly to issues across your fleet.
q
To address these needs, we built a telemetry pipeline that’s both flexible and fast. We hope sharing our approach will help others who are starting their own journey into kernel observability.
Architecture: tracepoints, ringbuf, and a Go-based telemetry pipeline
Our solution is built on a few key pillars:
- Tracepoints everywhere:
We instrument our kernel modules with tracepoints—special hooks that let us emit metrics, traces, or logs exactly where we need them.
- Stability and compatibility: Tracepoints are stable and low-overhead, making them ideal for production use. They’re supported across all non-EOL kernel versions, unlike newer mechanisms such as kprobes or fentry, which may not be available everywhere.
- Fine-grained control: Tracepoints give us precise control over where to emit telemetry, even from deep inside a function. In contrast, kprobes and fentry are best for hooking into syscall entry and exit points, but are more complicated to use for arbitrary locations.
- Efficient data transfer: All telemetry data is sent to user space via a high-performance, lockless ring buffer (ringbuf). This avoids the contention and complexity of eBPF hashmaps, and lets us stream large volumes of events efficiently, without polling or complex synchronization.
If you want to learn more about tracepoints, check out our blog posts: From Breakpoints to Tracepoints: An Introduction to Linux Kernel Tracing and From Tracepoints to Metrics: A Journey from Kernel to User Space.
-
Minimal kernel data, enriched in user space: We gather only the kernel-exclusive telemetry data, keeping things fast and efficient. Enrichment happens in user space, where we add additional context.
-
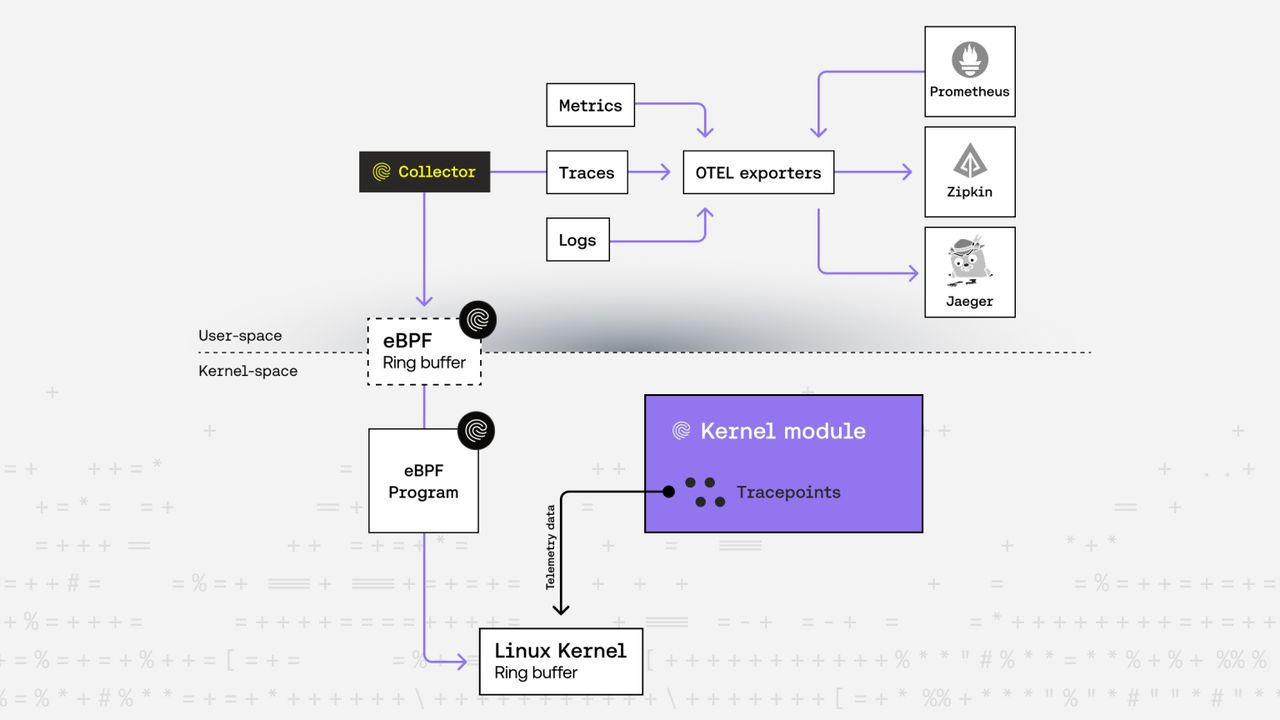
Go and cilium/ebpf for user-space telemetry collection and eBPF deployment: Our user-space collector is written in Go, leveraging the cilium/ebpf library to load eBPF programs, attach them to tracepoints, and read telemetry from the ringbuf. This combination lets us iterate quickly, maintain a modern codebase, and integrate seamlessly with the latest observability stacks and tools.
-
Aggregation, enrichment, and OTEL export: The collector aggregates, filters, and enriches telemetry data to add the necessary context for accurate and clear understanding. This enrichment and correlation step ensures that the telemetry is meaningful and actionable. After this, the data is converted to OTEL format. Metrics are sent to Prometheus, while logs and traces are sent to tracing platforms that support OTEL integration, such as Jaeger or Zipkin.
Key takeaways
Kernel telemetry isn’t just about collecting numbers—it’s about building feedback loops that make your systems smarter, safer, and more resilient. Whether you’re just starting out or you’re a seasoned expert, there’s always more to discover and improve. The journey to robust observability is ongoing, and every challenge is an opportunity to learn. At Riptides, this visibility is what powers our identity fabric, letting us enforce and validate non-human identity policies with confidence, precision, and speed. If you care about secure, kernel-native control, this level of observability is essential.
If you enjoyed this post, follow us on LinkedIn and X for more updates. If you'd like to see Riptides in action, get in touch with us for a demo.